What is a P/E Ratio?
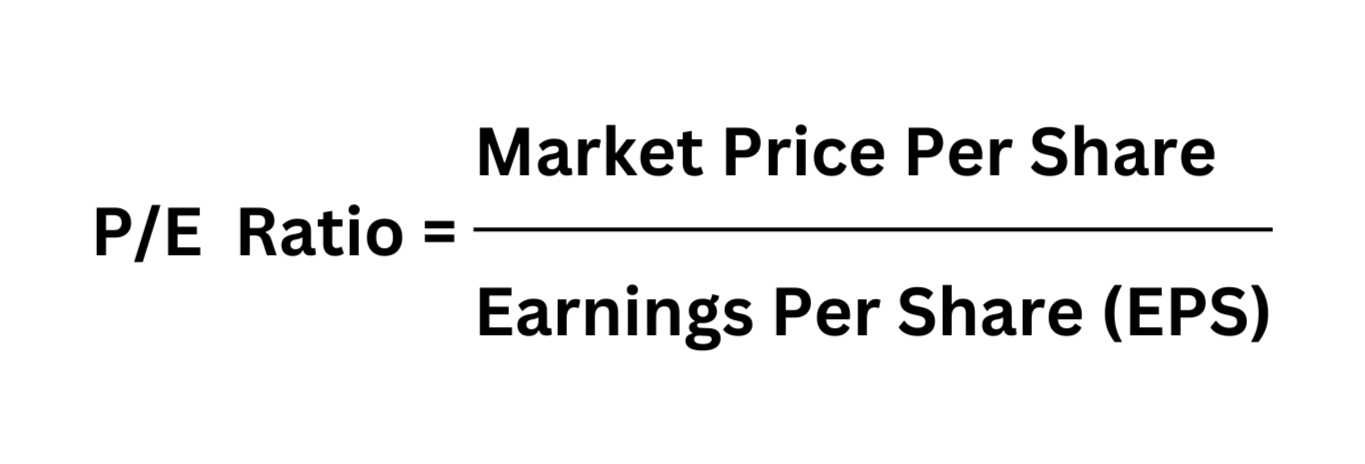
To know what or how P/E Ratio matters or works, one needs to know the meaning of P/E Ratio along with its definition. In simple words, Price-to-Earnings (P/E) ratio is a key financial metric used to assess the valuation of a company’s stock. It measures the relationship between a company’s current share price or current market price (CMP) and its earnings per share (EPS). This provides insight into how much investors are willing to pay for every buck of the company’s earnings.
Formula of P/E Ratio
P/E Ratio Formula (Dalal Post)
The P/E ratio is calculated using the following formula:
Here,
Market Price per Share: This is the current trading price of the company’s stock in the market.
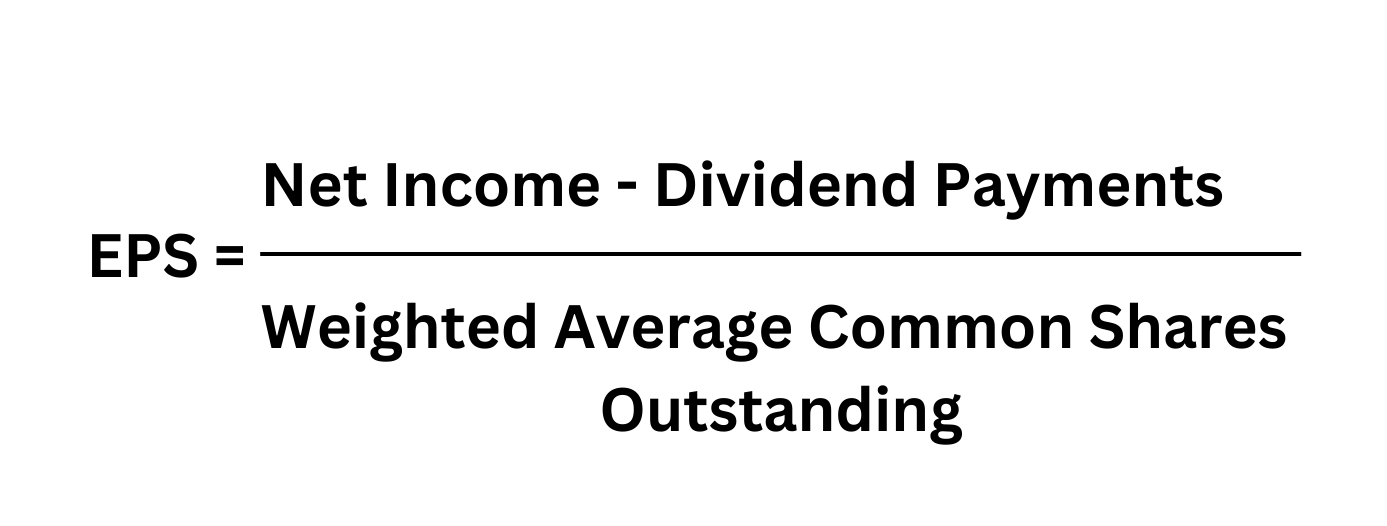
Earnings per Share (EPS): This represents the company’s profit divided by the number of outstanding shares. EPS can be calculated as:
Earnings per share (EPS) = (Net Income – Preferred Dividends) ÷ Weighted Average Common Shares Outstanding
Types of P/E Ratios
There are several types of P/E ratios that investors use to assess stock valuation:

- Trailing P/E Ratio: This ratio is the most common type of ratio and is calculated by using the earnings per share (EPS) from the last 12 months. P/E Ratio reflects past performance and thus, is useful for assessing how the market values a company based on its recent earnings.
- Forward P/E Ratio: Forward P/E ratio uses projected earnings for the upcoming fiscal year. This ratio provides insight into future growth expectations as well as helps investors gauge how much they are willing to pay for future earnings.
- Shiller P/E Ratio (Cyclically Adjusted P/E or CAPE): This ratio uses average inflation-adjusted earnings over the past 10 years. It smooths out the effects of economic cycles, offering a longer-term perspective on valuation.
- PEG Ratio (Price/Earnings to Growth): While not a pure P/E ratio, the PEG ratio incorporates earnings growth into the analysis. It divides the P/E ratio by the expected annual growth rate of earnings, helping investors evaluate whether a stock is over or undervalued relative to its growth prospects.
- Relative P/E Ratio: This compares a company’s P/E ratio to the average P/E of its industry or the broader market. It helps investors understand how a stock is valued relative to its peers.
- Negative P/E Ratio: This occurs when a company has negative earnings. While it can be misleading, it can indicate that the company is currently unprofitable but may still have growth potential.
Importance of P/E Ratio
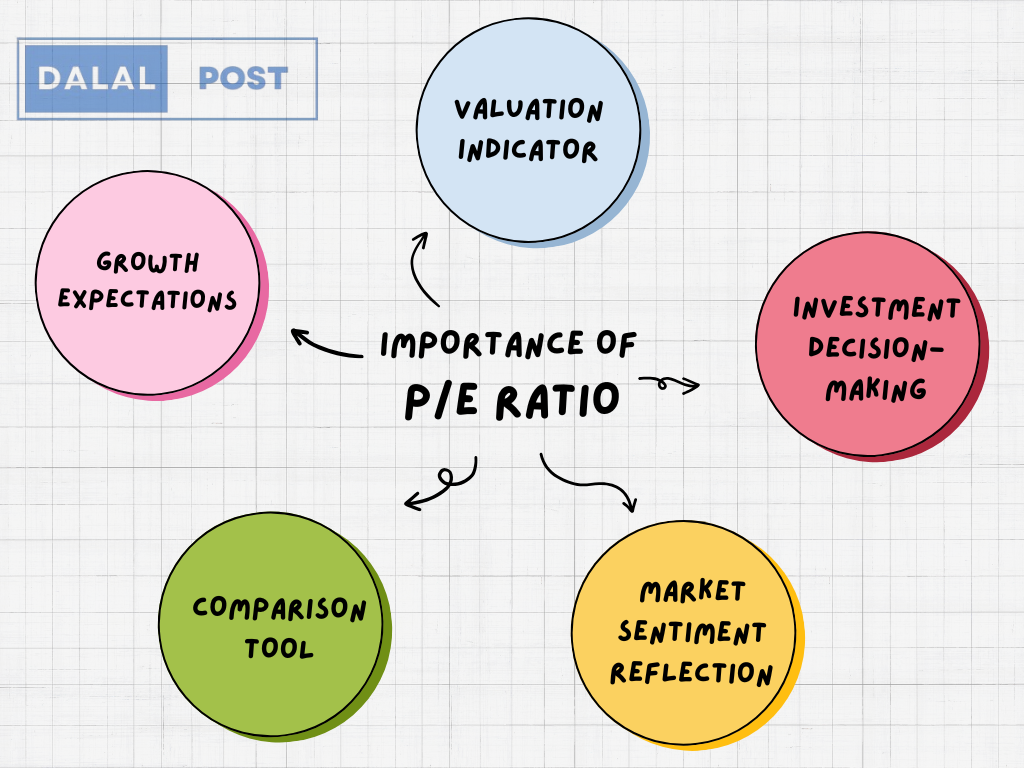
The (Price-to-Earnings) P/E ratio is an important financial metric used by investors to assess the valuation of a company’s stock. Mentioned below are some of the key reasons as to why the P/E ratio is important:
- Valuation Indicator: The P/E ratio helps investors determine whether a stock is overvalued, undervalued, or fairly valued compared to its earnings. A high P/E might suggest that a stock is overvalued, while a low P/E could indicate that the stock is undervalued.
- Comparison Tool: P/E ratio allows for easy comparison between companies within the same industry. By comparing P/E ratios, investors can identify which companies may offer better value relative to their earnings.
- Growth Expectations: A high P/E ratio can indicate that investors expect high growth rates in the future, while a low P/E might suggest lower growth expectations. This helps in assessing market sentiment towards a company’s future performance.
- Investment Decision-Making: P/E ratio is often used in investment strategies to decide whether to buy, hold, or sell a particular stock. It can guide investors on the timing of their investments based on the perceived value.
- Market Sentiment Reflection: Changes in the P/E ratio over time can reflect shifts in market sentiment, economic conditions, or changes in the company’s business model, helping investors gauge the overall market landscape.
Uses of the P/E Ratio
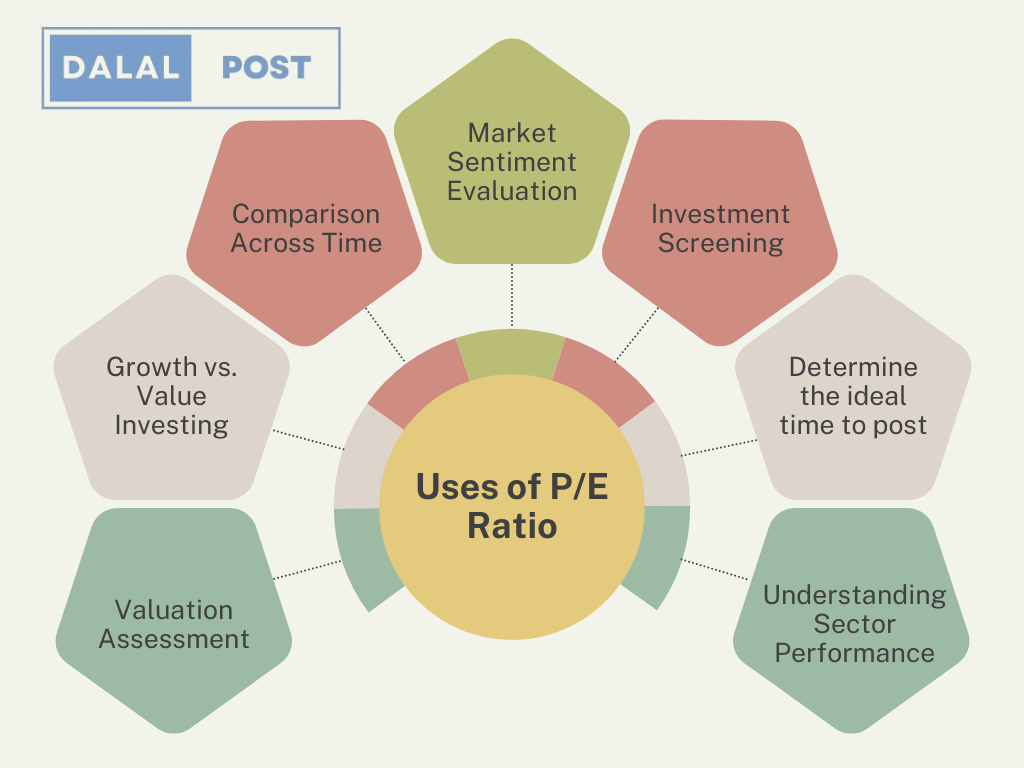
- Valuation Assessment:
Example: If Company A has a P/E ratio of 15 and Company B has a P/E of 25, investors might consider Company A to be undervalued relative to Company B, assuming both companies are in the same industry and have similar growth prospects.
- Growth vs. Value Investing:
Example: A growth investor might look for stocks with high P/E ratios (e.g., 30 or higher) because they believe the company will experience significant growth in earnings. In contrast, a value investor may seek out stocks with lower P/E ratios (e.g., below 15), seeing them as bargains. (PS. P/E Ratio values vary depending on the sector of the company’s operation.)
- Comparison Across Time:
Example: An investor analyses a company’s historical P/E ratio, which has typically been around 18. If the current P/E is 25, it could suggest that the stock is overvalued compared to its historical average, prompting the investor to reconsider the investment.
- Market Sentiment Evaluation:
Example: If the overall market P/E ratio rises significantly, it may indicate bullish sentiment among investors. For instance, if the S&P 500 has a P/E ratio of 20, but the historical average is 15, this could suggest investors are overly optimistic about future earnings.
- Investment Screening:
Example: An investor uses a stock screener to filter for companies with a P/E ratio below 15 and a PEG ratio below 1. This helps identify potentially undervalued stocks that are also expected to grow, making them attractive investment opportunities.
- Identifying Cyclical Trends:
Example: In cyclical industries, like construction, a low P/E ratio during a downturn may indicate a buying opportunity, as earnings are expected to recover when the economy improves.
- Understanding Sector Performance:
Example: An investor compares the P/E ratios of tech companies, which often have higher P/E Ratio (e.g., 25-35), to those in more stable industries, such as utilities, which may have P/E Ratio of around 15. This helps measure the relative risk and growth expectations across sectors.
Factors Influencing the P/E Ratio
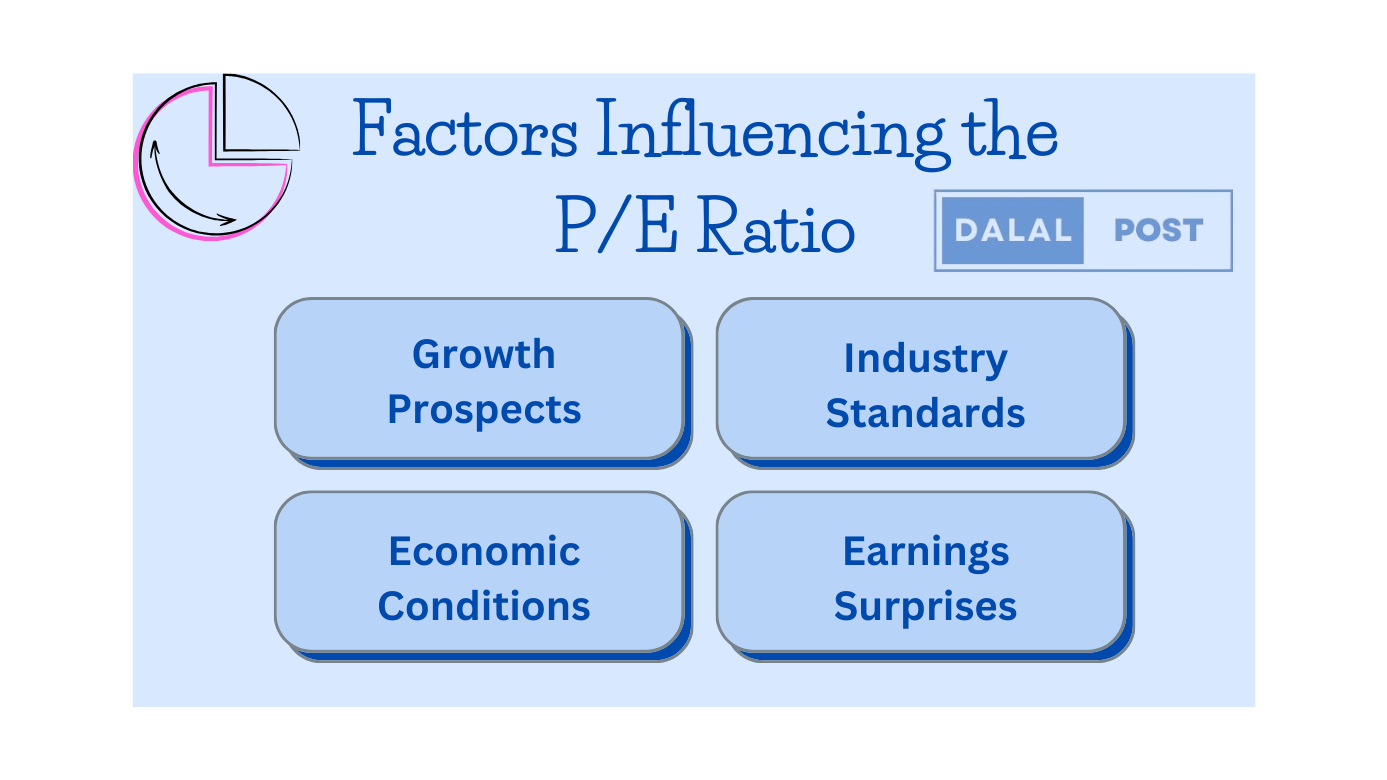
- Growth Prospects: Companies with higher growth expectations usually have higher P/E ratios as investors are willing to pay a premium for anticipated future earnings.
- Industry Standards: Diverse industries have varying average P/E ratios. For example, technology companies typically have higher P/E ratios due to growth potential, while mature industries like utilities may have lower ratios.
- Economic Conditions: Interest rates and inflation are some of the macroeconomic factors that can affect P/E ratios. In a strong economy, P/E ratios may increase as investor confidence grows.
- Earnings Surprises: Quarterly earnings announcements can cause significant fluctuations in a company’s P/E ratio. Positive revelations can drive up the P/E, while negative results can cause it to drop.
Limitations of the P/E Ratio
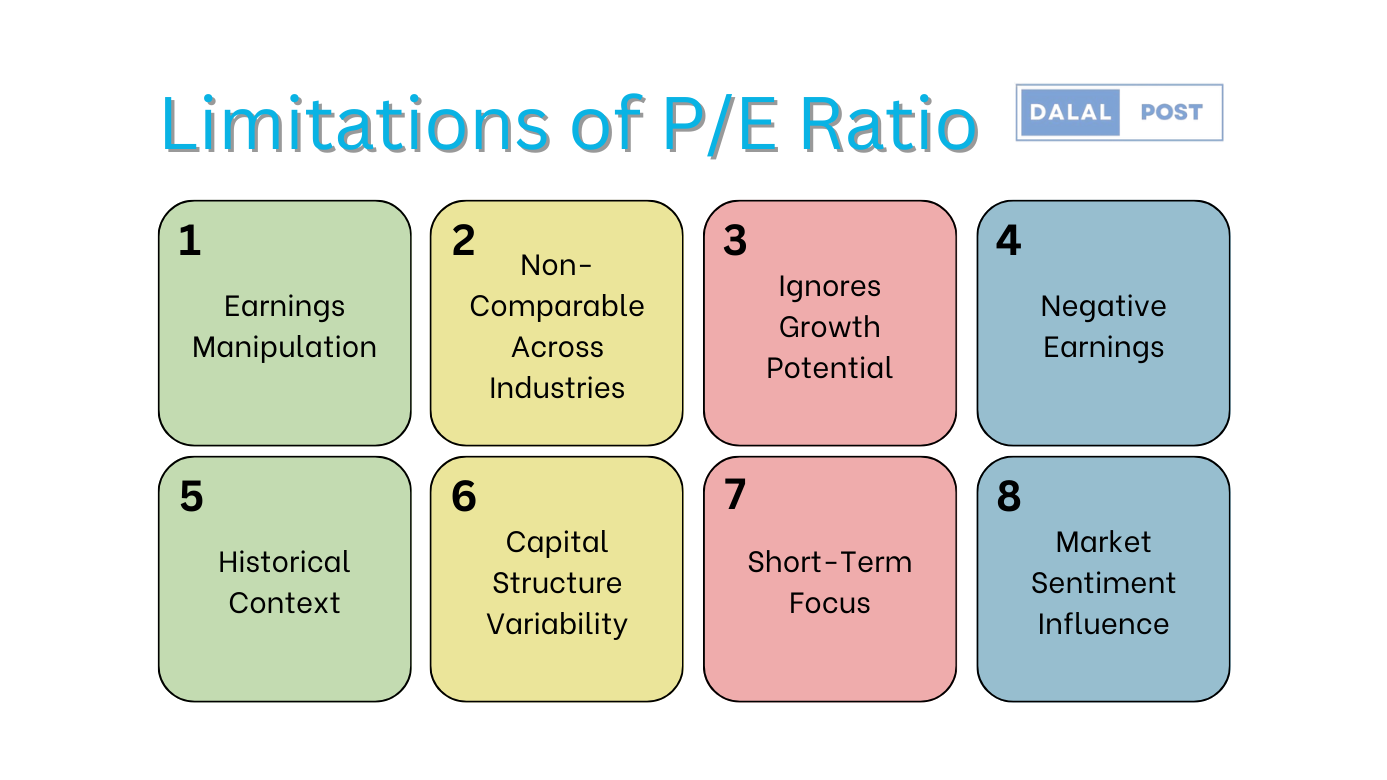
- Earnings Manipulation: Companies can use accounting practices to manipulate earnings, which can distort the P/E ratio.
- Non-Comparable Across Industries: Different industries have varying growth rates and capital requirements, making direct comparisons misleading.
- Ignores Growth Potential: A high P/E may indicate overvaluation, but it can also reflect high growth expectations that aren’t captured in the ratio.
- Negative Earnings: For companies with negative earnings, the P/E ratio is meaningless or can be misleading.
- Historical Context: The ratio is often based on historical earnings, which may not be indicative of future performance.
- Capital Structure Variability: P/E does not consider a company’s debt levels, which can significantly affect financial health.
- Short-Term Focus: It can encourage a focus on short-term earnings rather than long-term growth and sustainability.
- Market Sentiment Influence: The P/E ratio can be heavily influenced by market sentiment, leading to fluctuations that don’t reflect the company’s fundamentals.
Conclusion
In conclusion, P/E ratio serves as a useful tool for investors looking to evaluate a company’s valuation in relation to its earnings. PE Ratio matters as it provides insights into market expectations and can aid in spotting stocks that may be overvalued or undervalued. However, its limitations—such as vulnerability to earnings manipulation, differences across industries, and a lack of context for growth potential—mean that relying solely on the P/E ratio can lead to misleading conclusions. To make well-informed investment choices, it’s important to use the P/E ratio in conjunction with other financial metrics and qualitative factors, offering a more rounded perspective on a company’s overall health and future potential.

